Ever watched a bouncing ball hit the floor and rebound? Or seen it hit the ceiling and come back down? That’s essentially what support and resistance levels do in the financial markets. They’re invisible floors and ceilings that prices seem to respect—until they don’t.
I remember my first trading days, staring at charts with complete bewilderment. “Why does the price keep stopping at this exact point?” I wondered. That question led me down the rabbit hole of technical analysis, with support and resistance becoming my trusted companions ever since.
Understanding Support and Resistance: The Cornerstones of Technical Analysis
What Are Support and Resistance Levels?
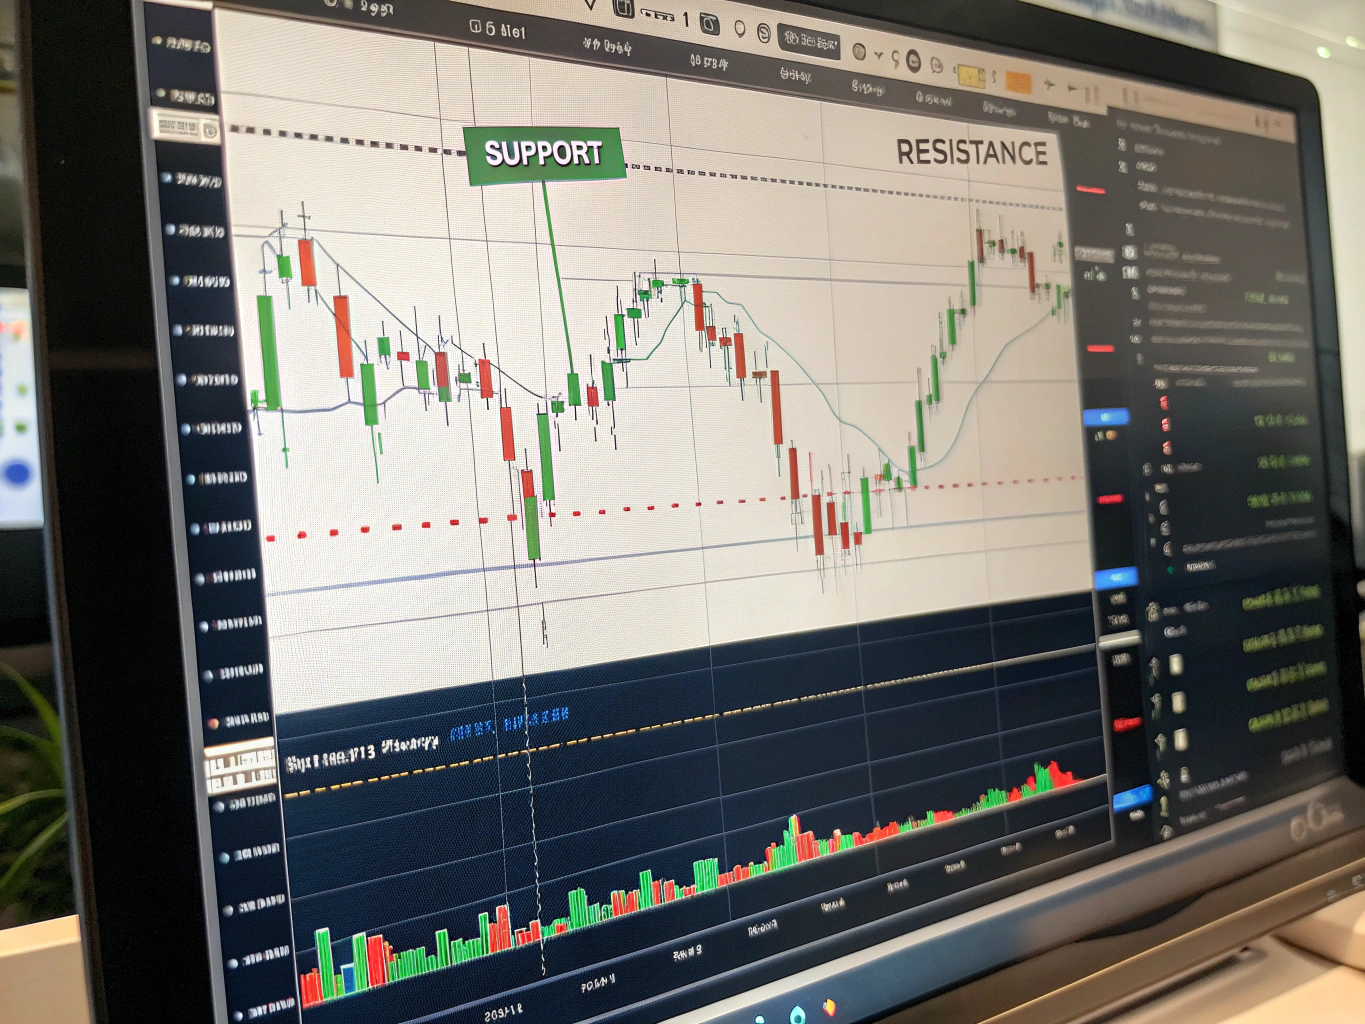
Support and resistance levels are price points on a chart where the probability of a price reversal increases. A support level is a price point where downward movement tends to stall as buying pressure overcomes selling pressure. Conversely, resistance is where upward movement typically pauses as selling pressure overcomes buying pressure.
What really blows my mind is how these invisible lines can influence market behavior so consistently. They’re like psychological barriers that traders collectively create and respect.
Historical Context and Development
Support and resistance concepts aren’t new—they’ve been fundamental to technical analysis since the early 20th century when Charles Dow first developed his theories. These principles were further refined by technical analysts like W.D. Gann and Ralph Nelson Elliott, who observed that markets tend to move in predictable patterns.
Side note: While researching this article, I discovered that Japanese rice traders were using similar concepts in the 18th century with candlestick charting—centuries before Western markets caught on!
Importance in Predicting Price Movements
These levels matter because they help traders anticipate potential price reversals or breakouts. When a price approaches a known support level, traders often look for buying opportunities. Similarly, as price nears resistance, they might prepare to sell or short the asset.
In my experience, understanding these levels can dramatically improve your entry and exit timing. I’ve watched countless traders (myself included) save thousands by simply respecting these invisible boundaries.
Mastering Support and Resistance: Essential Concepts for Every Trader
Types of Support and Resistance
Support and resistance come in two main flavors:
Static Levels: These are horizontal price points that remain constant over time. Think of them as hard floors and ceilings that prices bounce off repeatedly.
Dynamic Levels: These move with time and are often represented by trend lines or moving averages. They’re like escalators rather than staircases—constantly shifting but still providing meaningful boundaries.
Personally, I think dynamic levels are trickier to master but often more valuable in trending markets. I struggled with these at first, constantly drawing and redrawing my trend lines until I developed a feel for them.
Psychological Aspects Influencing These Levels
Let’s unpack this—support and resistance aren’t just lines on a chart; they represent human psychology in action. Round numbers (like $50, $100, or $10,000 for Bitcoin) often become psychological barriers simply because they feel significant to us humans.
Honestly, this worries me about algorithmic trading—will these psychological levels hold as much importance when machines do most of the trading? So far, they still seem to matter, perhaps because algorithms are designed to anticipate human behavior.
Common Misconceptions
The biggest myth? That support and resistance levels are exact price points. They’re not—they’re more like zones where price action is likely to change direction.
Another misconception is that once broken, a level becomes irrelevant. Actually, former resistance often becomes new support (and vice versa)—a phenomenon called “role reversal” that I find endlessly fascinating.
The Art of Trading: How to Identify and Utilize Support and Resistance Levels
Tools and Indicators for Identifying Levels
Here’s the deal—you don’t need fancy tools to spot these levels, but several indicators can help:
- Trend Lines: Connect a series of lows for support or highs for resistance
- Moving Averages: Popular dynamic support/resistance indicators (especially the 50, 100, and 200-day MAs)
- Fibonacci Retracement Levels: Based on the Fibonacci sequence, these identify potential reversal points
- Pivot Points: Daily, weekly, or monthly calculated levels used by many day traders
Wait—there’s more! Volume profile tools can also reveal price levels where significant trading activity occurred, often creating support or resistance.
Real-World Examples
Let me share a quick story. In 2020, Bitcoin repeatedly tested the $10,000 level as resistance before finally breaking through. Those who recognized this level could have:
- Sold near $10,000 during failed breakout attempts
- Bought after a confirmed breakout above $10,000
- Set stop losses just below this level after it became support
This single level played a crucial role in Bitcoin’s journey from $10,000 to $60,000+. Boom!
Tips for Integration
Grab your notebook—these three points are crucial:
- Always confirm levels with multiple time frames. What looks like support on a 5-minute chart might be meaningless on a daily chart.
- Look for confluence—where multiple types of support/resistance align at one price point.
- Consider the strength of levels based on how many times they’ve been tested and how much time has passed since formation.
Support and Resistance Strategies: Enhancing Your Trading Performance
Breakout and Reversal Strategies
Breakout Trading: This involves entering a position when price breaks through a significant support or resistance level, anticipating that the momentum will continue in the breakout direction.
Reversal Trading: Here, you’re looking to enter trades when price bounces off support or resistance, betting that the level will hold and price will reverse direction.
Or rather, you might combine both approaches—using smaller positions for reversal attempts and adding to your position if a breakout occurs instead.
Risk Management Techniques
Support and resistance levels provide natural places for stop-loss orders:
- When buying at support, place stops just below the support level
- When selling at resistance, place stops just above the resistance level
My initial mistake was placing stops exactly at these levels. Yikes! I quickly learned that “stop hunting” is real—price often briefly penetrates these levels before reversing.
Combining with Other Technical Indicators
Support and resistance work best when confirmed by other signals:
- Volume spikes near levels add credibility
- RSI divergence near support/resistance can signal potential reversals
- Candlestick patterns forming at these levels provide additional confirmation
This reminds me of the trading mantra: “One indicator is an observation, two is a coincidence, three is a strategy.” I’ve found this to be absolutely true when working with support and resistance.
Drawing the Line: Techniques for Accurately Marking Support and Resistance Levels
Different Methods for Drawing Levels
There are several approaches to drawing these levels:
Horizontal Lines: The simplest method—connect two or more price points where reversals occurred.
Trend Lines: Connect a series of higher lows (ascending support) or lower highs (descending resistance).
Channels: Combine parallel support and resistance trend lines to create a price channel.
Phew! Drawing these correctly takes practice. I spent months refining my technique before feeling confident in my level placement.
Importance of Time Frames
The longer the time frame, the more significant the support/resistance level. A level visible on a weekly chart carries more weight than one only visible on a 15-minute chart.
Try this yourself: Compare the same asset across multiple time frames and note how the important levels become more apparent on longer time frames.
Common Mistakes to Avoid
Ever felt like you’re the only one who can’t draw these levels correctly? You’re not alone. Here are pitfalls to avoid:
- Drawing too many levels: This creates confusion. Focus on the most significant ones.
- Forcing precision: Remember, these are zones, not exact prices.
- Ignoring volume: Levels formed on high volume are typically stronger.
- Not adjusting levels over time: Markets evolve, and so should your analysis.
Conclusion: Building Your Trading Foundation
Support and resistance analysis isn’t just a technical tool—it’s a window into market psychology. These levels represent the collective memory of market participants and often become self-fulfilling prophecies.
As you develop your trading strategy, make support and resistance identification a cornerstone practice. Start by marking major levels on your favorite assets, then watch how price interacts with them over time. You’ll soon develop an intuitive feel for these invisible but powerful market forces.
Remember that no level holds forever—markets break through eventually. The skill lies in recognizing when respect for a level is likely to continue and when conditions suggest a breakout is imminent.
Seriously, if you only master one aspect of technical analysis, make it support and resistance. It’s the foundation upon which countless successful trading strategies are built.
Now go chart some levels and see for yourself how often price respects these invisible boundaries. Your trading account will thank you.


