In the vast landscape of technical analysis tools, few indicators have gained as much respect and widespread use as Bollinger Bands. Whether you’re a seasoned trader or just beginning your journey in the financial markets, understanding this versatile indicator can significantly enhance your trading decisions and risk management strategies.
Introduction to Bollinger Bands: What They Are and How to Use Them
Bollinger Bands were developed in the early 1980s by John Bollinger, a renowned technical analyst and financial market expert. What began as a personal trading tool quickly evolved into one of the most recognized volatility indicators in the financial world. Bollinger created these bands to address a fundamental question: are prices high or low on a relative basis?
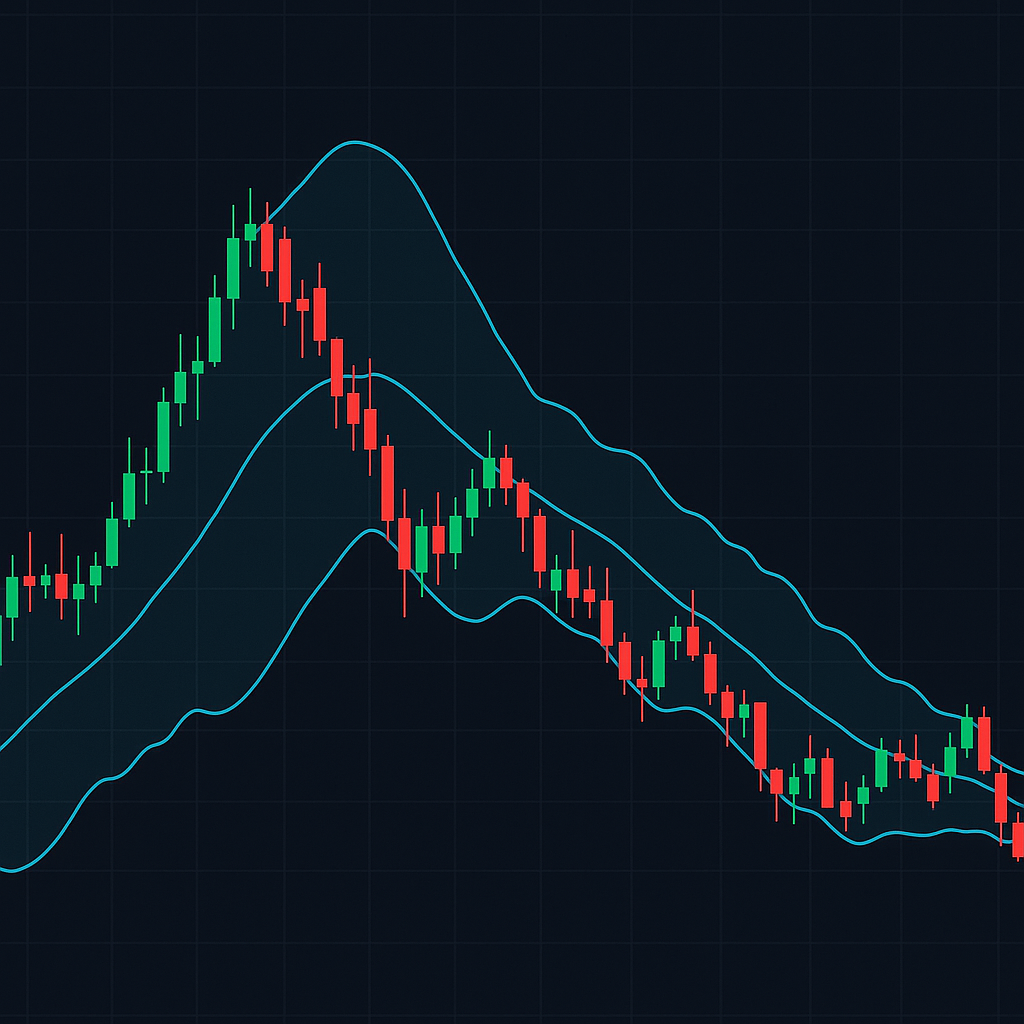
At their core, Bollinger Bands consist of three lines displayed on a price chart:
- A middle band, which is typically a 20-period simple moving average (SMA)
- An upper band, positioned two standard deviations above the middle band
- A lower band, positioned two standard deviations below the middle band
The beauty of this indicator lies in its simplicity and effectiveness. The bands expand when market volatility increases and contract when volatility decreases, creating a dynamic envelope that adapts to changing market conditions.
To apply Bollinger Bands in your trading platform, you’ll typically need to:
- Select the Bollinger Bands indicator from your charting software
- Choose your preferred settings (the standard is 20 periods with 2 standard deviations)
- Apply the indicator to your price chart
- Observe how the bands interact with price movements
Traders often use Bollinger Bands to identify potential entry and exit points, recognize overbought or oversold conditions, and gauge market volatility at a glance.
What Bollinger Bands Tell Investors
Bollinger Bands provide several key insights that can inform your trading decisions:
Market Volatility Assessment
The width of the bands directly reflects market volatility. When the bands widen, it indicates increasing volatility, suggesting that significant price movement may be imminent. Conversely, when the bands narrow (known as a “squeeze”), it suggests low volatility—often a precursor to a substantial price move in either direction.
Overbought and Oversold Conditions
One of the most common applications of Bollinger Bands is identifying potential overbought or oversold conditions:
- When prices touch or move beyond the upper band, the market may be overbought
- When prices touch or move beyond the lower band, the market may be oversold
However, it’s important to note that touching the bands alone isn’t necessarily a signal to buy or sell. Prices can “walk the band” during strong trends, repeatedly touching or even riding along a band for extended periods.
Trend Identification and Confirmation
The direction of the middle band (the moving average) can help identify the overall trend:
- An upward-sloping middle band suggests an uptrend
- A downward-sloping middle band suggests a downtrend
- A flat middle band indicates a ranging market
When price action stays predominantly above the middle band, it reinforces an uptrend. Conversely, price action that remains mostly below the middle band reinforces a downtrend.
The Basics of Bollinger Bands®
To fully appreciate Bollinger Bands, it’s essential to understand the fundamental concepts behind them:
Standard Deviation: The Volatility Measure
Standard deviation is a statistical measure that quantifies the amount of variation or dispersion in a set of values. In the context of Bollinger Bands, it measures how much the price deviates from its average (the middle band). Higher standard deviation values indicate greater price volatility.
The standard setting uses two standard deviations for the upper and lower bands, which statistically encompasses about 95% of all price action. This means that approximately 95% of price movements should occur within the bands, making movements outside the bands potentially significant.
Moving Average: The Foundation
The simple moving average (SMA) forms the middle band and serves as the base from which the upper and lower bands are calculated. The standard 20-period SMA provides a good balance between responsiveness and stability, though traders can adjust this parameter based on their trading timeframe and strategy.
The Calculation Behind the Bands
While modern trading platforms automatically calculate Bollinger Bands, understanding the formula helps appreciate how the indicator works:
- Middle Band = 20-period simple moving average (SMA)
- Upper Band = Middle Band + (2 × 20-period standard deviation of price)
- Lower Band = Middle Band – (2 × 20-period standard deviation of price)
These calculations ensure that the bands automatically adjust to market conditions, widening during volatile periods and narrowing during calmer ones.
Bollinger Bands: What They Are, and What They Tell Investors
Beyond the basics, Bollinger Bands offer sophisticated insights that experienced traders can leverage for more nuanced market analysis.
The Bollinger Bounce
One common pattern is the “Bollinger Bounce,” where prices tend to return to the middle band after touching either the upper or lower band. This phenomenon works particularly well in ranging markets where no strong trend is present.
For example, if a stock price touches the lower band and then starts moving upward, traders might consider entering a long position, anticipating that the price will “bounce” back toward the middle band or even the upper band.
The Bollinger Squeeze
The “Bollinger Squeeze” occurs when volatility falls to a very low level, causing the bands to narrow significantly. This compression often precedes major price movements, as periods of low volatility are typically followed by high volatility.
Traders watch for the bands to start widening again after a squeeze, which may signal the beginning of a new trend. The direction of the initial price breakout from the squeeze can indicate the potential direction of the emerging trend.
W-Bottoms and M-Tops
Bollinger Bands can help identify specific chart patterns:
- W-Bottoms: A double bottom pattern where the second low is higher than the first and occurs outside the lower band
- M-Tops: A double top pattern where the second high is lower than the first and occurs outside the upper band
These patterns can signal potential reversals and provide trading opportunities with favorable risk-reward ratios.
Bollinger Bands Might Be The Only Indicator You’ll Ever Need
While no single indicator provides a complete market picture, Bollinger Bands offer remarkable versatility that few other indicators can match.
Cross-Market Application
One of the greatest strengths of Bollinger Bands is their applicability across virtually any market:
- Stocks and indices
- Forex pairs
- Commodities
- Cryptocurrencies
- Futures and options
The bands work effectively across all these markets because they adapt to each market’s specific volatility characteristics.
Timeframe Flexibility
Whether you’re a day trader working with 5-minute charts or a long-term investor analyzing weekly data, Bollinger Bands maintain their effectiveness across different timeframes. You might adjust the settings slightly (perhaps using 10-period bands for shorter timeframes or 50-period bands for longer ones), but the core principles remain the same.
Complementary Indicators
While Bollinger Bands can stand alone, they often work best when combined with other indicators:
- Volume indicators can confirm breakouts beyond the bands
- Momentum oscillators like RSI can confirm overbought/oversold conditions
- Trend indicators can provide additional context for band interpretations
For instance, if price touches the upper band while the RSI shows overbought conditions and volume is declining, this combination might provide a stronger sell signal than any single indicator alone.
Real-World Success
Frankly, this surprised me when I first started trading, but many successful traders rely heavily on Bollinger Bands. Consider the case of a forex trader who noticed the EUR/USD pair experiencing a Bollinger Squeeze on the daily chart in early 2020. When the bands began widening and price broke below the lower band with increasing momentum, they entered a short position that captured a significant portion of the March 2020 decline.
Similarly, stock traders who identified the Bollinger Squeeze in Tesla shares in early 2020 before its dramatic rise could have positioned themselves for substantial gains by entering when prices broke convincingly above the upper band.
Limitations and Best Practices
While Bollinger Bands are powerful, they’re not without limitations:
- They’re reactive rather than predictive, based on past price action
- False signals can occur, especially in choppy markets
- They don’t specify exact entry and exit points
- Like all indicators, they can fail during extreme market conditions
To maximize their effectiveness:
- Avoid using Bollinger Bands in isolation
- Confirm signals with other indicators or price action
- Consider the broader market context and fundamental factors
- Adjust settings based on your trading timeframe and the specific asset
- Practice with historical data before trading real money
Remember these three factors when using Bollinger Bands:
- The context of the market matters
- Multiple timeframe analysis improves accuracy
- Patience in waiting for clear signals pays off
Conclusion: Incorporating Bollinger Bands Into Your Trading Strategy
Bollinger Bands have stood the test of time for good reason. They provide valuable insights into market volatility, potential reversal points, and trend strength in a visually intuitive format. Their adaptability across markets and timeframes makes them an essential tool in any trader’s arsenal.
To get started with Bollinger Bands:
- Begin by observing how they behave on your preferred assets
- Note how prices interact with the bands during different market conditions
- Start with paper trading to test strategies without financial risk
- Gradually incorporate them into your live trading with proper risk management
Whether you’re a day trader looking for short-term opportunities or a long-term investor seeking to optimize entry and exit points, Bollinger Bands offer a versatile framework for making more informed trading decisions.
While no indicator guarantees success, mastering Bollinger Bands will undoubtedly enhance your market analysis capabilities and potentially improve your trading results. As John Bollinger himself often says, “Tags of the bands are just tags, not signals”—reminding us that these tools require thoughtful interpretation rather than mechanical application.
Let’s unpack this: Bollinger Bands aren’t just another indicator—they’re a window into market psychology, revealing the ongoing battle between buyers and sellers through the lens of volatility and price action. By understanding and applying this powerful tool, you’ll gain a significant edge in navigating the complex world of financial markets.


