The Relative Strength Index (RSI) stands as one of the most popular and effective technical indicators in a trader’s toolkit. Whether you’re just starting your trading journey or looking to refine your technical analysis skills, understanding how to properly interpret and apply RSI can significantly enhance your trading decisions.
Understanding the Relative Strength Index (RSI): A Comprehensive Guide
The Relative Strength Index, developed by J. Welles Wilder in 1978, is a momentum oscillator that measures the speed and change of price movements. This powerful indicator has stood the test of time, remaining relevant in today’s fast-paced trading environment.
Definition of RSI and its purpose in trading
RSI is fundamentally a momentum indicator that compares the magnitude of recent gains to recent losses to determine overbought and oversold conditions of an asset. Its primary purpose is to signal potential reversal points in the market by identifying when an asset has been pushed to extremes.
The beauty of RSI lies in its versatility—it can be applied to stocks, forex, commodities, cryptocurrencies, and virtually any tradable asset with price data.
Explanation of how RSI is calculated (formula and components)
The RSI calculation might seem complex at first glance, but understanding its components helps appreciate how it works:
RSI = 100 – [100 / (1 + RS)]
Where RS (Relative Strength) = Average Gain / Average Loss
Typically, these averages are calculated over 14 periods, though this parameter can be adjusted. The calculation process involves:
- Calculating the gain or loss for each period
- Computing the average gain and average loss over the specified timeframe
- Dividing the average gain by the average loss to get the RS
- Applying the RS to the formula above to determine the RSI value
Overview of the RSI scale (0-100) and what different levels indicate
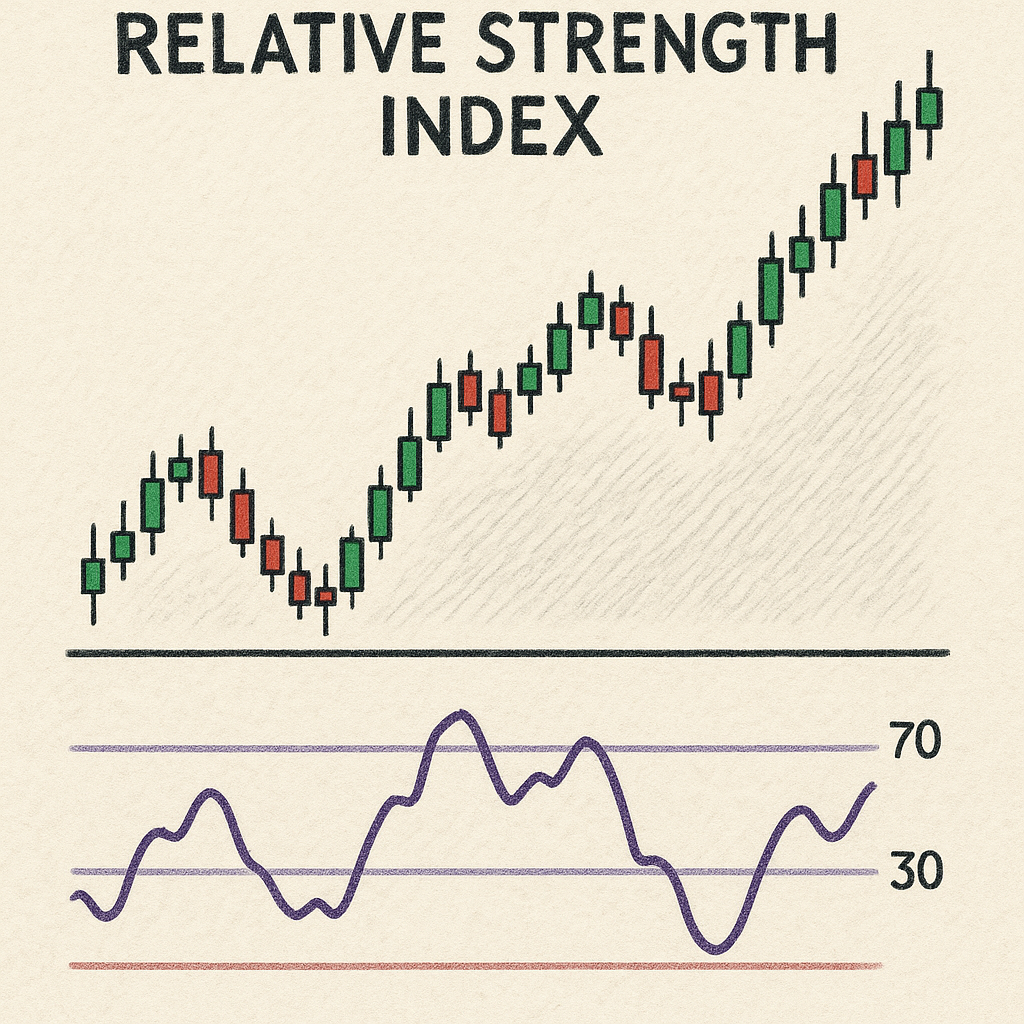
The RSI oscillates between 0 and 100, creating a bounded range that makes interpretation straightforward:
- RSI above 70: Generally considered overbought territory
- RSI below 30: Generally considered oversold territory
- RSI at 50: Represents neutral momentum
Some traders use more extreme thresholds (80/20 or 90/10) for stronger signals in volatile markets or during strong trends.
Importance of RSI in identifying overbought and oversold conditions
The primary strength of RSI lies in its ability to identify potential price exhaustion points. When an asset becomes overbought (RSI > 70), it suggests that buying pressure may be waning and a reversal could be imminent. Conversely, when an asset becomes oversold (RSI < 30), selling pressure might be exhausted, potentially signaling an upcoming bounce.
However, it’s crucial to understand that overbought doesn’t automatically mean “sell,” and oversold doesn’t automatically mean “buy.” In strong trends, assets can remain in overbought or oversold territory for extended periods.
Mastering RSI: Buy and Sell Signals Explained
Knowing how to interpret RSI signals effectively can transform your trading approach from reactive to proactive.
Explanation of how to interpret RSI signals for trading decisions
RSI signals typically fall into several categories:
- Overbought/oversold conditions
- Divergences between price and RSI
- Support and resistance levels on the RSI itself
- Centerline (50) crossovers
Each signal type provides different insights into market conditions and potential price movements.
Buy signals: Identifying when RSI crosses above 30
One of the most common RSI buy signals occurs when the indicator crosses above the 30 level, exiting oversold territory. This suggests that selling pressure is diminishing and buyers are regaining control.
For stronger confirmation, look for:
- RSI forming a higher low while below 30
- Price action support coinciding with the RSI signal
- Increased volume as RSI moves above 30
Remember, the context matters—these signals tend to work best in ranging markets rather than strong downtrends.
Sell signals: Recognizing when RSI crosses below 70
Conversely, a common sell signal materializes when RSI crosses below the 70 threshold after being in overbought territory. This indicates that buying momentum is weakening and sellers are stepping in.
For more reliable sell signals, watch for:
- RSI forming a lower high while above 70
- Resistance levels in price aligning with the RSI signal
- Volume expansion as RSI drops below 70
These signals typically perform better in sideways markets than in powerful uptrends.
Examples of real-world scenarios where RSI signals were effective
During the March 2020 market crash, many stocks reached extremely oversold levels with RSI readings below 20. Those who identified the subsequent RSI crossovers above 30 in quality companies like Apple and Microsoft captured significant gains in the recovery that followed.
Similarly, in the cryptocurrency market, Bitcoin showed classic RSI overbought signals in November 2021 before its major correction. Traders who respected these signals were able to lock in profits before the reversal.
The Role of RSI in Technical Analysis: Enhancing Your Trading Strategy
RSI doesn’t exist in isolation—its true power emerges when integrated with other technical tools and market context.
Discussion on the integration of RSI with other technical indicators
RSI works exceptionally well when combined with:
- Moving Averages: When price crosses above a key moving average while RSI moves above 30, it creates a stronger buy signal.
- MACD: Confirmation from both indicators (RSI leaving oversold territory while MACD forms a bullish crossover) increases signal reliability.
- Bollinger Bands: RSI oversold conditions coinciding with price touching the lower Bollinger Band often identify high-probability reversal points.
- Volume indicators: Volume confirmation of RSI signals significantly enhances their reliability.
How RSI can confirm trends and reversals in price action
RSI excels at confirming both trend continuations and potential reversals:
For trend confirmation:
- In uptrends, RSI typically oscillates between 40 and 80
- In downtrends, RSI usually fluctuates between 60 and 20
- RSI crossing above 50 in an uptrend confirms trend strength
- RSI crossing below 50 in a downtrend validates continued weakness
For reversal identification:
- RSI divergences (price makes new highs/lows while RSI doesn’t) often precede significant reversals
- Failure swings (RSI failing to reach overbought/oversold on subsequent price moves) can signal exhaustion
Case studies of successful trading strategies that utilize RSI
Many professional traders have built successful systems around RSI. For instance, the “RSI-2” strategy developed by Larry Connors focuses on extremely short-term RSI readings to identify mean reversion opportunities. This approach has shown remarkable success rates in backtesting across various market conditions.
Another effective approach combines RSI with support/resistance levels. When price approaches a significant support level while RSI is oversold, the probability of a successful bounce increases substantially.
Tips for incorporating RSI into a broader trading plan
To maximize RSI effectiveness:
- Define your trading timeframe and adjust RSI settings accordingly (shorter periods for day trading, longer for swing trading)
- Always consider the broader market context and trend
- Use RSI as a confirmation tool rather than a standalone signal generator
- Combine RSI with price action analysis for better results
- Document and review your RSI-based trades to refine your approach
Common Mistakes When Using the RSI Indicator
Even experienced traders can fall into traps when using RSI. Awareness of these pitfalls can improve your application of this indicator.
Overview of frequent errors traders make when using RSI
The most common RSI-related mistakes include:
- Trading solely based on RSI without considering other factors
- Using inappropriate RSI settings for your timeframe
- Ignoring the overall market trend when interpreting signals
- Failing to adjust thresholds for different market conditions
- Not allowing for confirmation of signals before taking action
Misinterpretation of overbought and oversold signals
Perhaps the biggest misconception is that overbought automatically means “sell” and oversold automatically means “buy.” In reality:
- During strong uptrends, assets can remain overbought for extended periods
- During strong downtrends, assets can stay oversold for prolonged durations
- Overbought conditions in uptrends often represent strength, not weakness
- Oversold conditions in downtrends frequently indicate continued selling pressure, not buying opportunities
Frankly, this misunderstanding has cost many traders significant money when they fight against powerful trends based solely on RSI readings.
Ignoring market context and other indicators
RSI doesn’t exist in a vacuum. The same RSI reading can have completely different implications depending on:
- The overall market trend
- Recent price patterns
- Volume characteristics
- News and fundamental factors
- Seasonal tendencies
For example, an RSI reading of 30 during a strong market uptrend might represent a minor pullback and excellent buying opportunity. The same reading during a market crash could simply be the beginning of further declines.
Over-reliance on RSI without considering price action
RSI is a derivative of price—it doesn’t contain information that isn’t already in the price chart. Therefore, always prioritize price action:
- Look for candlestick patterns that confirm RSI signals
- Identify key support/resistance levels that align with RSI readings
- Pay attention to volume that validates RSI movements
- Consider the overall price structure and trend
Advanced RSI Techniques: Beyond the Basics
Once you’ve mastered the fundamentals, these advanced RSI applications can take your analysis to the next level.
Introduction to advanced RSI strategies (e.g., divergence analysis)
RSI divergences are powerful signals that occur when price and RSI move in opposite directions:
- Bearish divergence: Price makes higher highs while RSI makes lower highs (warning of potential reversal down)
- Bullish divergence: Price makes lower lows while RSI makes higher lows (signaling possible reversal up)
These divergences often precede significant price reversals, especially when they occur at extreme levels.
Another advanced technique is failure swings:
- Bullish failure swing: RSI falls below 30, rallies, pulls back but stays above 30, then breaks its previous high
- Bearish failure swing: RSI rises above 70, drops, rebounds but stays below 70, then breaks its previous low
Explanation of how to use RSI in conjunction with other timeframes
Multi-timeframe RSI analysis provides a more comprehensive market view:
- Use longer timeframes to determine the primary trend
- Use intermediate timeframes to identify the current cycle
- Use shorter timeframes for precise entry and exit points
For example, a buy signal might be confirmed when:
- Weekly RSI is above 50 (indicating a bullish bias)
- Daily RSI is recovering from oversold conditions
- 4-hour RSI shows a bullish divergence
This approach helps filter out noise and identify higher-probability setups.
Discussion on customizing RSI settings for different trading styles
The standard 14-period RSI isn’t optimal for all situations:
- Day traders often use shorter periods (5-9) for more responsive signals
- Swing traders typically stick with the standard 14-period setting
- Position traders and investors might extend to 21 or even 30 periods for smoother readings
Additionally, some traders adjust the overbought/oversold thresholds:
- In strong uptrends, raising the oversold threshold to 40 and overbought to 80
- In strong downtrends, lowering the overbought threshold to 60 and oversold to 20
Tips for backtesting RSI strategies to improve effectiveness
To refine your RSI approach:
- Define clear entry and exit rules based on RSI
- Test across different market conditions (trending, ranging, volatile)
- Compare results with different RSI settings
- Analyze win rate, profit factor, and maximum drawdown
- Look for ways to filter out low-probability signals
- Consider adding complementary indicators to confirm RSI signals
Honestly, this process takes time, but the insights gained from proper backtesting can dramatically improve your trading results.
Conclusion
The Relative Strength Index remains one of the most valuable tools in technical analysis, offering insights into market momentum and potential reversal points. By understanding both its capabilities and limitations, you can effectively incorporate RSI into your trading strategy.
Remember that RSI works best when:
- Used in conjunction with other technical tools
- Interpreted within the context of the broader market trend
- Applied with settings appropriate for your trading timeframe
- Combined with sound risk management principles
As with any technical indicator, mastery comes through practice and experience. Start by paper trading RSI signals to build confidence in your interpretation before committing real capital. Over time, you’ll develop an intuitive feel for how RSI behaves in different market conditions.
By avoiding common pitfalls and implementing advanced techniques, RSI can become a cornerstone of your technical analysis approach, helping you identify high-probability trading opportunities across various market environments.


